
Coding skills in a CV?
The challenge
I wanted to rewrite my CV lately and I stumbled upon a small challenge.
I’m always looking to make it more readable for recruiters as it increases my chances they will actually take a glance at it.
So the question became: How can I present my coding skills in a quick and easy to read manner?
This is similar to challenges we encouter when presenting data in a paper. What is the “best” way to present your findings.
The idea
So naturally, I wanted to create a nice plot. But how can you show this information?
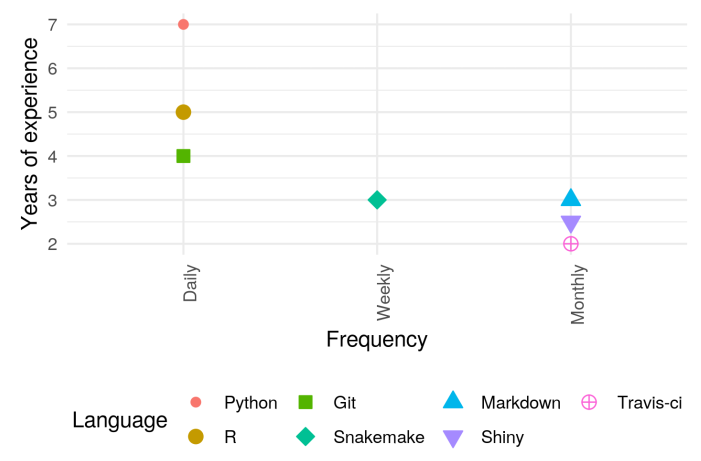
I went for two variables:
- Experience. Giving an idea of how long I’ve been working with this language/platform.
- Usage. Am I using it everyday? Once per year?
Here is the finished example:
The code
To get this you will need a csv input file as shown bellow:
Language,Started,Frequency
Python,2012,Daily
R,2014,Daily
Git,2015,Daily
Snakemake,2016,Weekly
Markdown,2016,Monthly
Shiny,2016.5,Monthly
Travis-ci,2017,Monthly
First column is the language you want to show, second is the year you started using it and the third is the frequency at which you code in it. Then we can run the code shown bellow:
First load up needed packages
library(ggplot2)
library(dplyr)
Read in the data and format the factors properly
languages = read.csv("input_file.csv", stringsAsFactors = FALSE)
languages$Language = factor(languages$Language, levels = languages$Language)
languages$Frequency = factor(languages$Frequency, levels=c('Daily', 'Weekly', 'Monthly'))
Use the current year to create the Year_of_experience variable
current_year = as.integer(format(Sys.Date(), "%Y"))

languages = languages %>%
  mutate(Years_of_experience = current_year - Started)
Finally create and save the plot. I specifically used color and shape for the language variable because sometimes CV’s will be printed in black and white.
p = ggplot(languages, aes(x=Frequency, y=Years_of_experience, color=Language, shape=Language,fill=Language))
p = p +  scale_shape_manual(values=c(20:25,10))
p = p + geom_point(size=3)
p = p + theme_minimal()
p = p +  theme(axis.text.x = element_text(angle = 90, hjust = 1),legend.position="bottom")
p = p + ylab('Years of experience')
ggsave(p, filename = "coding_skill.png", scale = 0.3, height = 11, width = 16)
This little code is part of my snakemake pandoc CV pipeline that helps me create a CV on the fly.